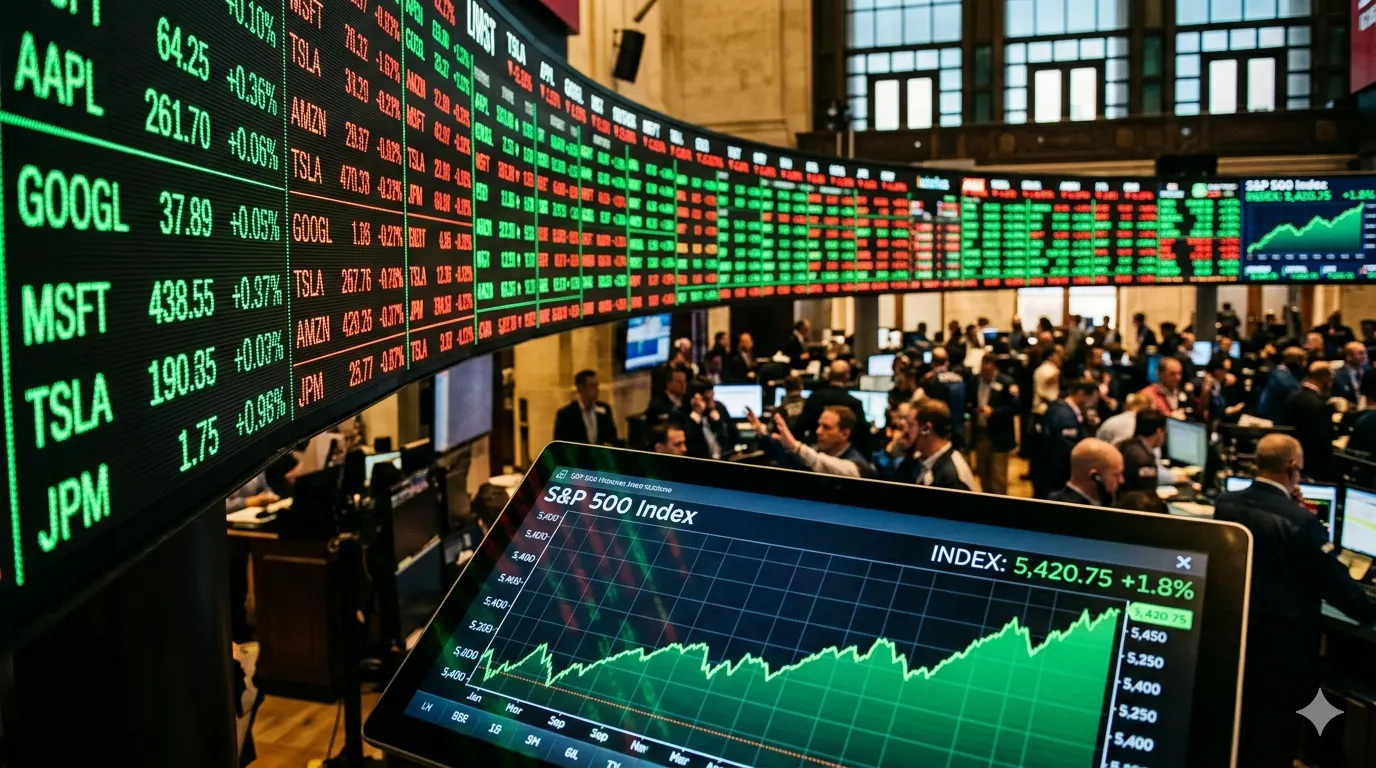
There are times in financial markets when data that should scare investors simply doesn't. May 13, 2026 was one of those moments. The US core producer price index (PPI) rose 1% monthly, a figure that normally would have triggered sell-offs in equities and a sharp reset in interest rate expectations. Instead, the S&P 500 and the Nasdaq closed the session at all-time highs, with market analysts describing the day as a "total anomaly": the stock market and volatility rising together, something that has historically preceded significant corrections.
To contextualize the magnitude of the 2026 rally: the S&P 500 has accumulated a rise of 17% since January, a figure that only in the years of most powerful expansion of bullish cycles had reached so early in the year. Goldman Sachs has a price target of 7,600 points by the end of 2026. AMD has shot up its revenue 38% in the most recent quarter. The results of the technology sector continue to surprise on the rise. And yet, macroeconomic signals paint a considerably more complicated picture than the stock market euphoria suggests.
The engine of the rally: technology and artificial intelligence
The main driver of the stock market highs of 2026 is known and is called artificial intelligence. Investment in AI infrastructure—data centers, specialized chips, software—is approaching $500 billion annually globally, and the companies benefiting from that spending are at the core of the S&P 500 and the Nasdaq. Nvidia, Microsoft, Alphabet, Amazon and Meta represent a proportion of the index's capitalization that has no historical precedent. Which means that when these companies do well, the index does well, regardless of what happens to the rest of the economy.
This level of concentration is both the rally's strength and vulnerability. Goldman Sachs, in its recent reports, points out that the 2026 rally is being "sustained by five giants" - referring to Big Tech - and that the breadth of the market, that is, the percentage of securities participating in the rise, is less than the headlines suggest. Many sectors of the S&P 500 are flat or negative for the year; technology companies are dragging the index up.
Wall Street — Key indicators · May 2026
- S&P 500: 7,404 points · +17% accumulated in 2026 · 6 consecutive weeks of increases
- Nasdaq Composite: 26,247 points · absolute historical record (May 8)
- May underlying PPI: +1% monthly · data well above expectations
- Goldman Sachs target for S&P 500 year-end: 7,600 points
- Concentration: 5 large technology companies represent approx. 27% of the S&P 500
- US GDP forecast 2026: 2.5–2.8% · well above the European average
The PPI at 6%: real problem or statistical noise?
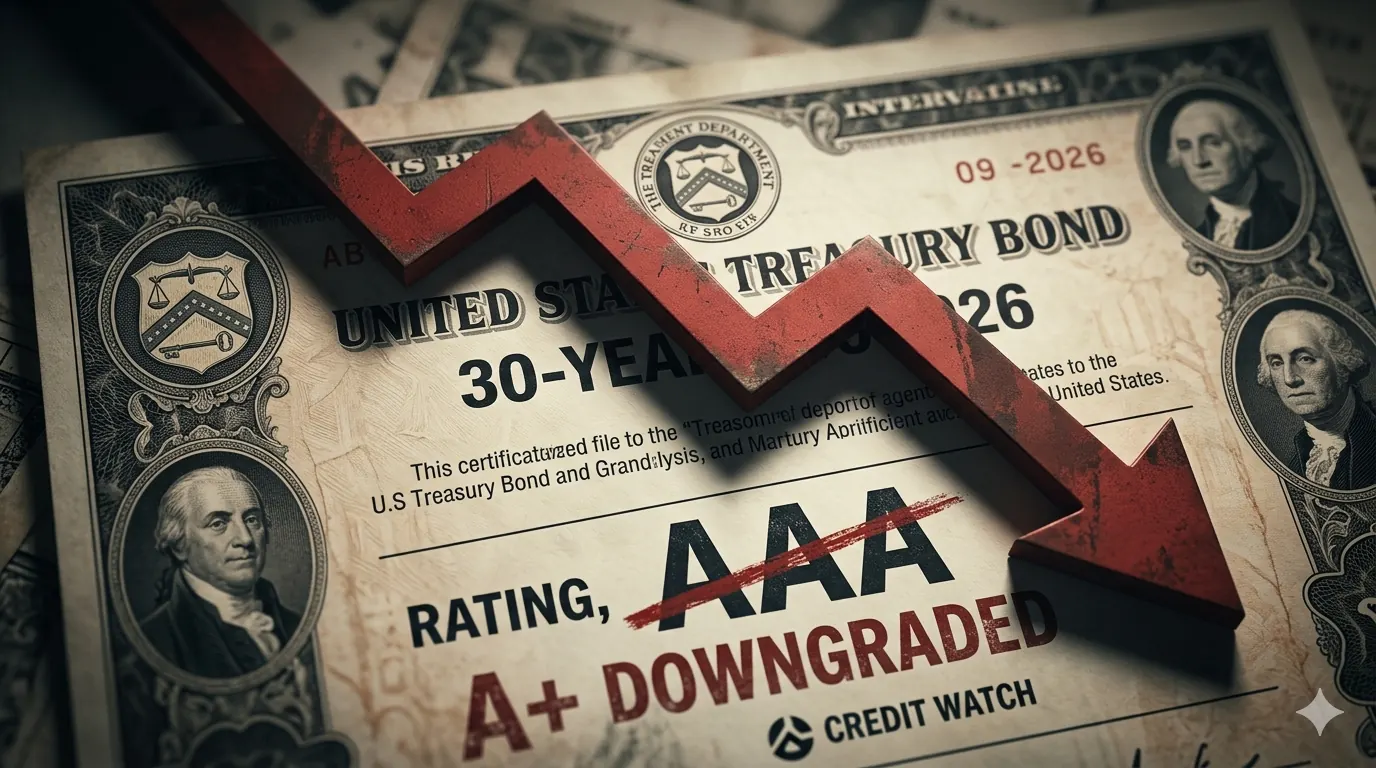
The most disturbing data of the month was the annualized underlying production price index (PPI) which, if the monthly rhythm of May is maintained, would point to rates above 6% in annualized terms. The PPI measures the prices that producers pay before the goods reach the consumer: it is, in that sense, a leading indicator of consumer inflation. If producers are paying more, sooner or later they will pass those costs on to the end consumer.
The most bullish analysts discount this data, arguing that it is distorted by the impact of Trump's tariffs, which have made imported inputs more expensive, and that this effect is transitory and does not reflect structural inflationary pressures. The most cautious point out that this is exactly what was said about 2021 inflation, which was also described as “transitory” before becoming the biggest economic problem of the last decade.
The paradox of the investor at maximums
For the investor with funds indexed to the S&P 500 or the MSCI World—the most common profile among individual investors in Spain who use platforms such as Indexa Capital, Trade Republic or Scalable Capital—the current highs raise the classic question: should I invest now or wait for a correction? The answer that historical evidence consistently supports is that time in the market systematically exceeds market timing. Data shows that the S&P 500 has been at “all-time highs” on approximately 30% of all trading days in its history. Anyone who waited for it to "go down" before investing generally waited too long.
For index investors: If you have scheduled regular contributions (DCA), the maximums do not change the optimal strategy. Goldman Sachs expects the first rate cut to come in December 2026, which has historically been an additional catalyst for equities.
Share this article